- Solutions
Healthcare
- Resources
Vendor Watch
Revenue cycle outsourcing raises a lot of questions. Now you can see all the right answers.
“
All vendors talk about the ROI they deliver. Vendor Watch gives us an objective way to compare their performance to our in-house people.
– Zane Newitt
CEO
Excalibur Data-Driven Management SolutionsFive things you should always know about your vendors:
- What’s the status of the accounts that I have out with vendors?
- Which of my collection vendors are doing the best job?
- Are any of them in violation of their SLAs?
- Do we have the right mix of outsourced and internal assignments?
- Are their invoices 100% accurate?
Introducing Vendor Watch. Now you can have real answers to all those questions, and more. Vendor Watch gives you total insight into the performance of your outsourced collection vendors – Extended Business Office (EBO), Bad Debt, and Early Out. Using your own transaction data, we show you the true performance of your vendors, and their impact on your bottom line. You see how much revenue they help you capture, how quickly, and from which payers. You can compare vendors side-by-side to get a sense of their relative performance. And you can compare the ROI of outsourcing to the ROI of keeping it in-house. In all, you can fine-tune the efficiency of your CBO like never before.
Key Features & Benefits
- Integrates and normalizes payer data
- Compares all vendors objectively
- Highlights vendor performance trends
- Compares performance on payer-by-payer basis
- Speed of thought drill paths
- Accelerates revenue collection
- Improves payer negotiations
- Accelerates revenue collection
- Compares the ROI of outsourcing to keeping it in-house
Give vendor performance the attention it deserves.
By combining data analytics, visual science and predictive algorithms, we give you insight into the past, present and future performance of your outsourced revenue cycle vendors, and your in-house activities. Supported by multi-years’ worth of historical assignment and payment data, we project how your vendors will perform against any number of different scenarios that you set. By using this solution, you can make decisions going forward with a greater degree of confidence.
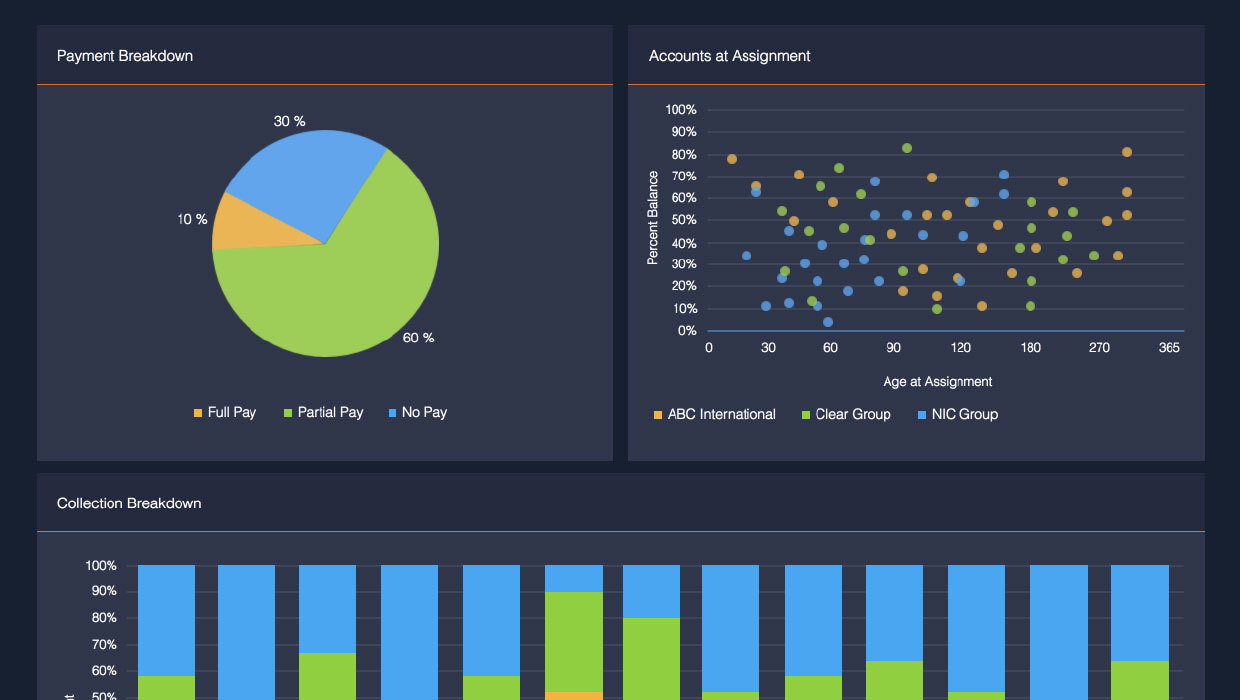
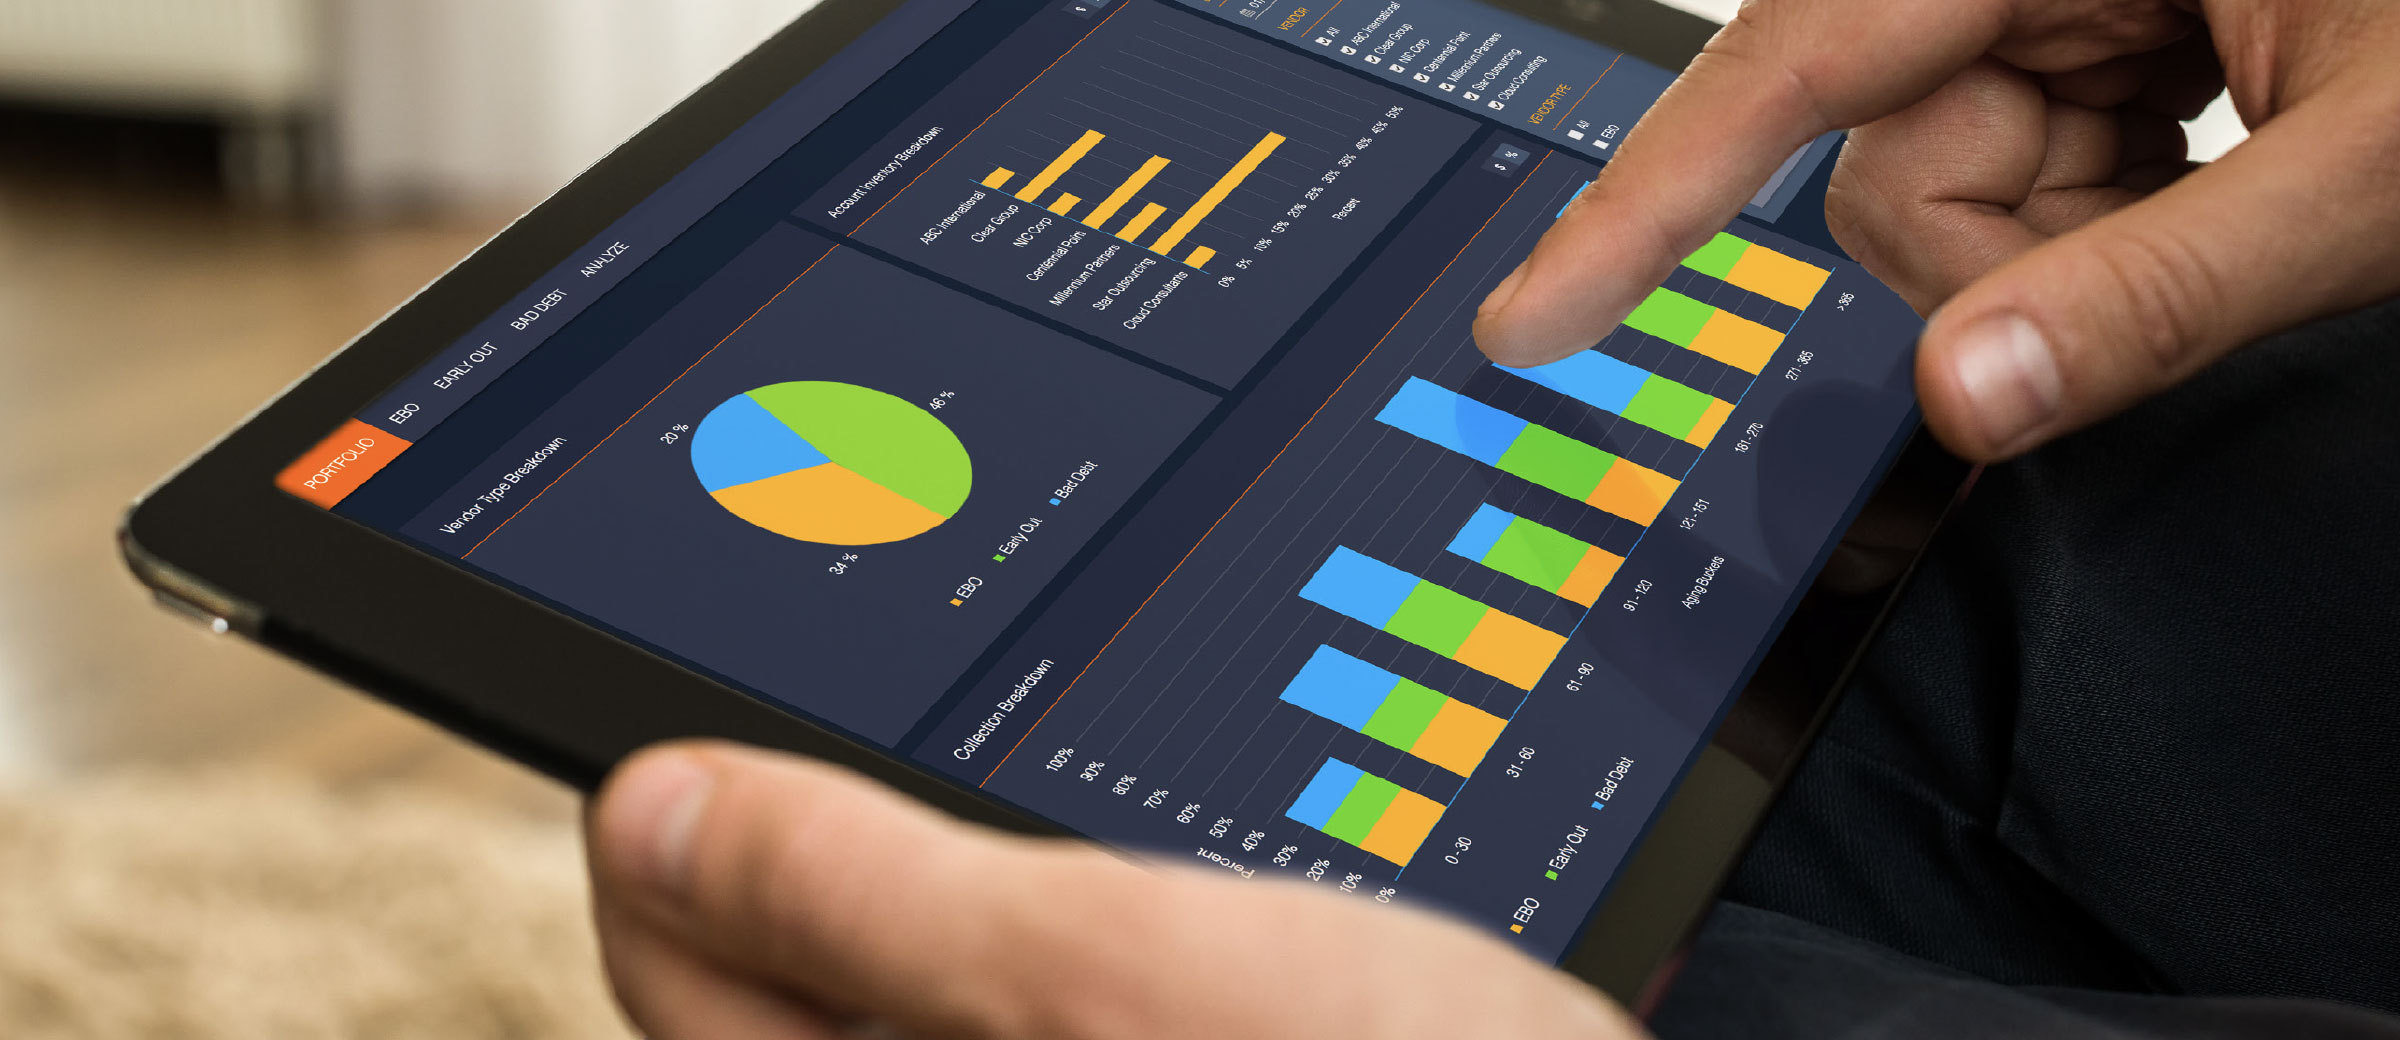
Combined Portfolio View
A true and current view of everything that you have assigned out to vendors: extended business office, early out, bad debt placements, and more. See who is holding what and how payments are trending over time. Filter by any timeframe, any group of vendors, any group of payers.
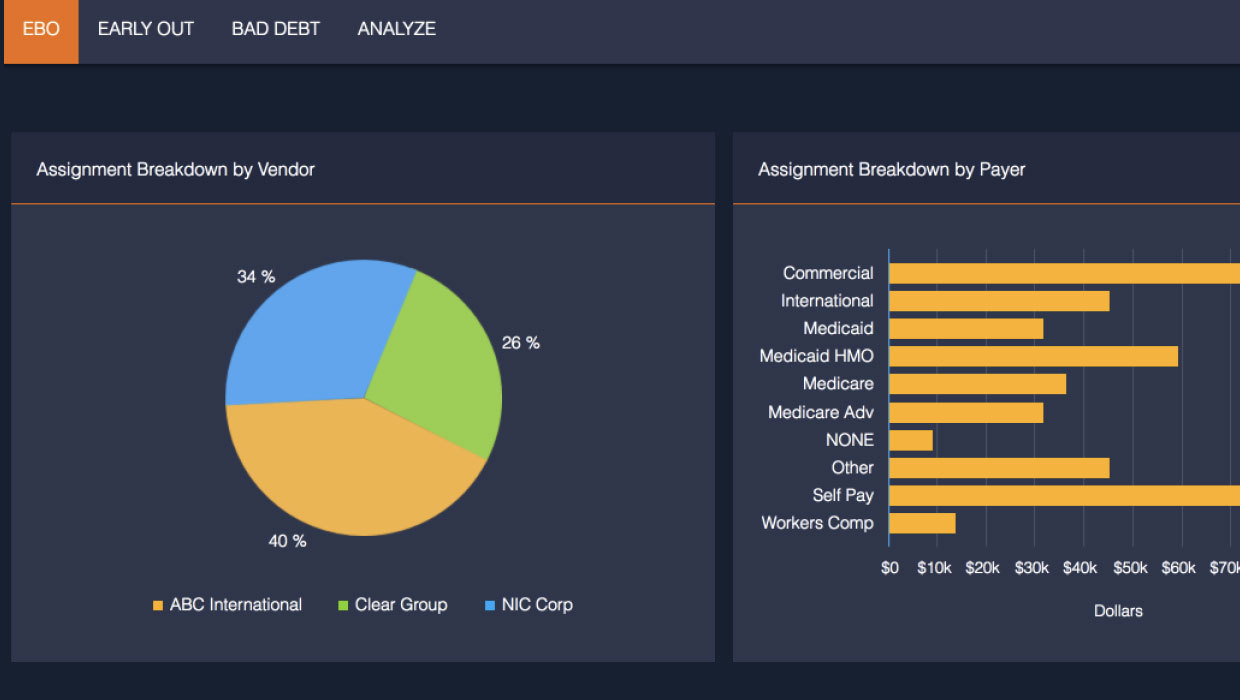
EBO, Early and Bad Debt Stratification
Each of these tabs breaks down your A/R assignments by vendor, payer, balance, age, and all related attributes and metrics. Compare your vendors across nine key vendor performance indicators, including Cost to Collect, Average to Zero Balance, and Variance from SLA.
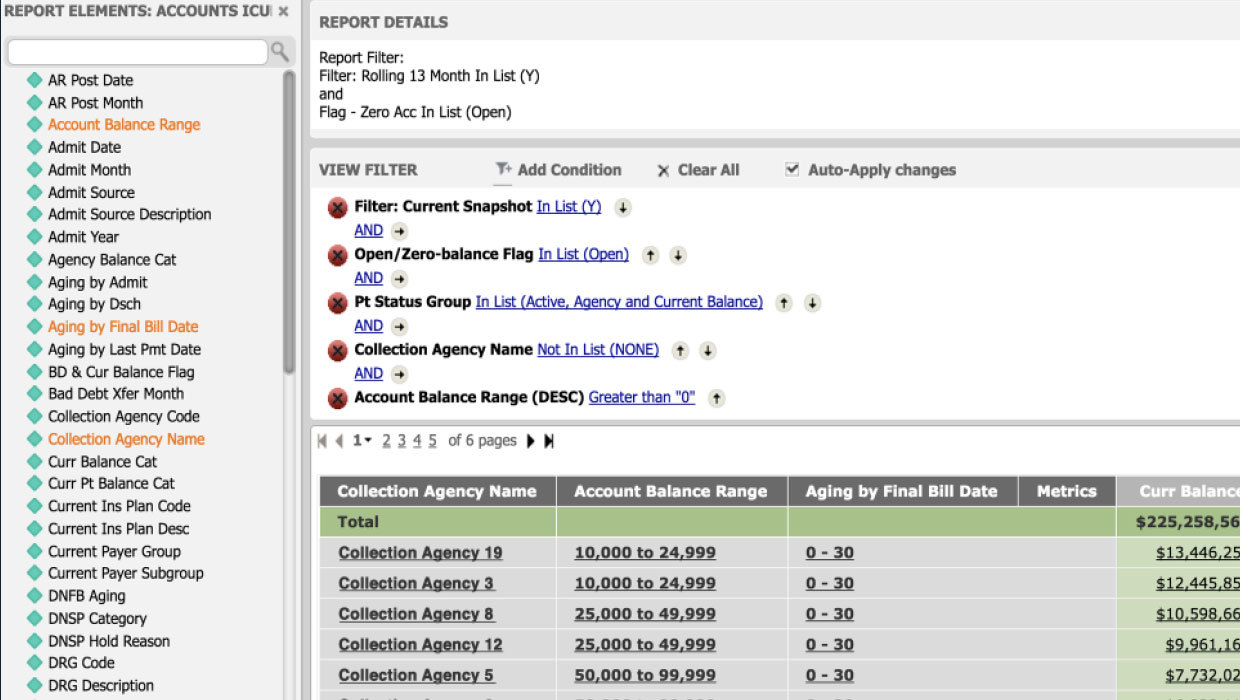
Ad Hoc Analysis – Numero
No need to write scripts or build queries. Easily build dashboards, scorecards and reports with VisiQuate’s drag-and-drop report builder.
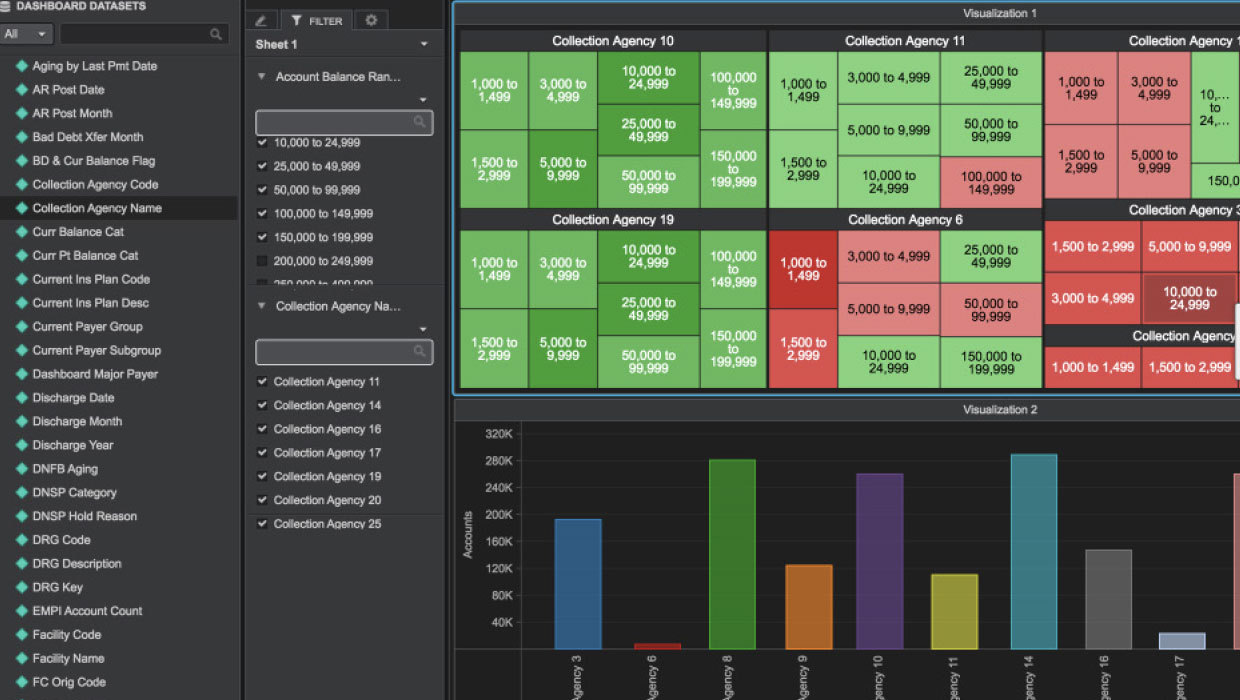
Ad-Hoc Analysis – Visual Insight
Drag and drop visualization building with all related attributes and metrics. Easily create, filter and redraw visuals with any data elements you need.
© 2025 VisiQuate, Inc. All Rights Reserved.


